BACKGROUND TO THE GEO-ECONOMIC LINEUP OF RUSSIA / UKRAINE AND EAST-CENTRAL EUROPE
This is a review of the available data for two important components of what the UN Human Development Program considers the level of "human development"--per capita GDP (GDP/cap) and Life Expectancy at Birth (LEB)--to provide some basic geo-economic background to the current military-geopolitical crisis in the region. The data come from here and here.
I present two graphs. They compare the Russian Federation and Ukraine to two separate reference groups--east-central Europe and the erstwhile USSR--in terms of their LEB and GDP/cap, for the years 1980, 1990, 2000, 2010 and 2019.
Let's see, first, how Ukraine and Russia have fared in comparison to east-central European neighbors.
 |
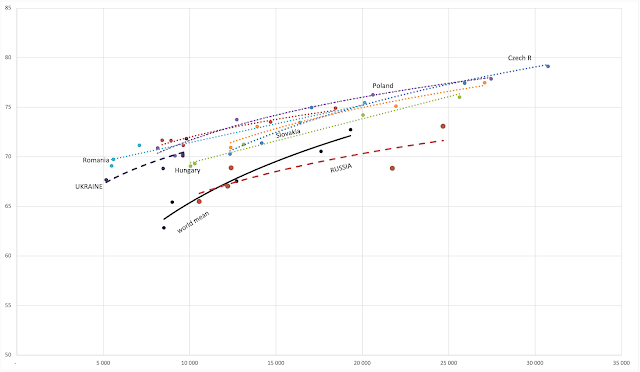
| Graph 1 Life Expectancy at Birth (years) by GDP/cap (2011 USD): Russia, Ukraine and east-central Europe, 1980-2019 |
Graph 1 prompts me to make the following three observations:
- Russia has a far higher per capita GDP than Ukraine. Ukraine appears "locked" below the lowest of all countries in the comparison with east-central Europe; it has not reached by 2019 the per capita GDP of the Hungary of 1980.
- Meanwhile, despite its lower economic "performance," Ukraine's Life Expectancy at Birth--widely regarded as a measure of the overall quality of life in a country--is considerably higher than Russia's; indeed it is quite comparable with the lower tier in LEB of east-central Europe.
- Poland--a key actor in the ongoing geopolitical conflict--has a somewhat, although not breathtakingly, higher per capita GDP than Russia; and one of the highest, in fact, for much of the period, the highest LEB in the region. In a devastating testimony to the history of post-Soviet life, Russia fell below the world average in terms of its GDP/cap-controlled Life Expectancy at Birth sometime in 1990s to 2000s, and has remained there ever since.
 |
| Graph 2 Life Expectancy at Birth (years) by GDP/cap (2011 USD): Russia, Ukraine and the Other Successor States of the Erstwhile USSR, 1980-2019 |
Here are my quick observations of the basic historical embeddedness of geo-economic lineup of the conflict, based on Graph 2:
- Leading the group in terms of both per capita GDP and Life Expectancy at Birth are, as expected, are the three Baltic states, with Estonia shooting off the chart, almost literally.
- Despite its reasonably strong per capita GDP performance, Russia's Life Expectancy at Birth is among the lowest among the 15 erstwhile republics of the former USSR: Only Turkmenistan (throughout the period), plus Tajikistan and Azerbaijan (in some years) show lower LEB estimates. Interestingly--an unintended reference to the previous post-Soviet geopolitical crisis of a few weeks ago--Kazakhstan's regression line almost completely overlaps with that of Russia, suggesting that the collective experiences of the two societies as a whole has been nearly identical (although, of late, Kazakhstan's per capita GDP has become somewhat higher than Russia's).
- Ukraine, in contrast, is wedged in the middle in terms of LEB of the lowest-GDP/cap group of the post-Soviet field. To repeat, Ukraine's Life Expectancy at Birth figures are markedly higher than those of Russia, in spite of its clearly lower per capita GDP.


Comments
Post a Comment